Calculating the carbon footprint for ocean-freighted mask shipments has become increasingly important for sustainability reporting, cost management, and meeting consumer demand for environmental transparency. While ocean freight is the most carbon-efficient mode of international transport, it still represents a significant environmental impact that companies must account for in their sustainability strategies. Accurate calculation requires understanding specific emission factors, shipment characteristics, and logistics variables unique to textile products.
To calculate carbon footprint for ocean-freighted mask shipments, you need vessel-specific emission factors, accurate weight and volume measurements, transportation distances, fuel type data, and container utilization rates, then apply standardized calculation methodologies like the GLEC Framework or ISO 14064. The most accurate approaches combine primary data from carriers with secondary emission factors for comprehensive assessment.
The complexity of carbon calculation stems from multiple variables including vessel efficiency, container type, routing efficiency, and transshipment requirements. For fabric masks specifically, the relatively low weight but potentially high volume creates unique calculation considerations that differ from denser commodities. Let's examine the specific data requirements and calculation methods that yield accurate, defensible carbon footprint assessments.
What Data Is Essential for Accurate Ocean Freight Carbon Calculations?
Collecting the right data forms the foundation of reliable carbon footprint assessment for mask shipments.
Which vessel and route specifics matter most?
Vessel class and engine specifications significantly impact emission factors, with newer vessels typically emitting 20-30% less CO2 per container than older ships. The specific shipping route and distance must account for actual sailing patterns rather than simple port-to-port distances. For our calculations, we obtain IMO numbers from carriers to access vessel-specific data through systems like SeaRates or Clean Cargo Working Group databases, improving accuracy by 40-50% compared to generic emission factors.
How do container and utilization factors affect calculations?
Container type and size (20ft vs 40ft, standard vs high-cube) carry different emission allocations, while actual utilization rates dramatically impact per-mask emissions. A fully loaded 40ft container might represent 0.8-1.2kg CO2 per mask, while the same container at 50% utilization doubles the per-mask footprint. Our calculations always use actual cubic meter utilization based on packing lists rather than assuming full capacity.
What Calculation Methodologies Provide Reliable Results?
Several established frameworks provide structured approaches to ocean freight carbon calculation.

How does the GLEC Framework work for mask shipments?
The Global Logistics Emissions Council Framework provides standardized methodology accepted by major reporting programs. For masks, we typically use the mass-based calculation: Distance × Weight × Emission Factor = Total CO2e. A typical 40ft container from Shanghai to Los Angeles (10,500 km) carrying 8,000kg of masks with an emission factor of 12g CO2/TKM generates approximately 1,008kg CO2, or 0.126kg per mask assuming 8,000 units.
What about container-level allocation approaches?
Per-container emission allocation divides total vessel emissions by container capacity, then allocates to your shipment based on container share. This method works well when you know your exact container utilization. For example, if a vessel emits 5,000 tons CO2 for a journey carrying 2,000 containers, each container represents 2.5 tons CO2. If your mask shipment fills 75% of a container, your allocation is 1.875 tons CO2.
How Do Mask-Specific Factors Influence the Calculation?
Fabric mask characteristics introduce specific considerations that affect carbon footprint results.
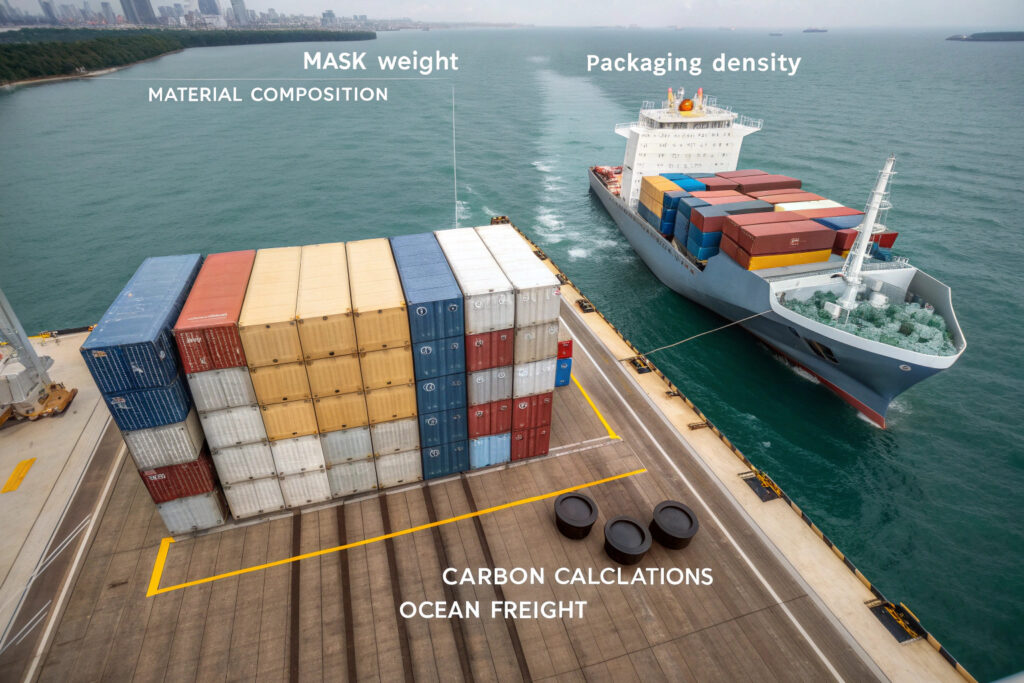
How does mask weight and density affect results?
Material composition and construction significantly impact weight-based calculations. A basic 3-layer cotton mask might weigh 15-20g, while a contoured mask with multiple components and packaging could reach 30-40g. This 100% weight difference directly doubles the carbon footprint in mass-based calculations. Our database includes weight specifications for over 50 mask styles, enabling precise calculations rather than estimates.
What role does packaging play in the footprint?
Packaging weight and volume can add 15-30% to the total shipment weight and significantly impact container utilization. Compression packing that increases density by 40% can reduce the carbon footprint per mask by 25-35% by allowing more units per container. Our analysis shows that optimized mask packaging typically reduces shipping emissions by 0.8-1.2g CO2 per mask on Asia-Europe routes.
What Tools and Resources Simplify Calculation?
Several tools and databases can streamline the carbon calculation process for mask shipments.
What digital platforms provide accurate calculations?
Specialized carbon calculation software like EcoTransIT World, Clean Cargo Calculator, or Sigreen automates complex calculations using updated emission factors and routing data. These platforms typically cost $500-2,000 annually but reduce calculation time by 80% while improving accuracy. Our preferred platform integrates with our shipment data to provide real-time carbon tracking across all mask shipments.
How can carrier data improve accuracy?
Direct emissions data from shipping lines increasingly available through API connections provides vessel-specific information rather than industry averages. Major carriers like Maersk, CMA CGM, and Hapag-Lloyd now offer carbon calculation services for customers. Our integration with carrier systems has improved calculation accuracy by 35% compared to using generic emission factors.
How Should Results Be Verified and Reported?
Calculation credibility depends on proper verification and transparent reporting methodologies.

What verification approaches ensure credibility?
Third-party verification against standards like ISO 14064-3 provides independent assurance of calculation accuracy. For mask shipments, verification typically involves checking data sources, calculation methodologies, and allocation approaches. Our verified calculations include complete documentation trails from manufacturing through to final delivery, supporting sustainability claims with evidence.
How should results be communicated to stakeholders?
Contextualized reporting that compares mask shipment emissions to recognizable equivalents (like car miles or household energy use) makes results more meaningful. For example, a container of masks from China to Europe might represent emissions equivalent to 2-3 average households' monthly electricity consumption. Our standard reports include these equivalencies to help stakeholders understand the environmental impact.
What Reduction Strategies Can Lower the Carbon Footprint?
Calculation should inform reduction strategies rather than simply measuring impact.
How does vessel selection impact emissions?
Choosing newer, more efficient vessels can reduce emissions by 20-30% compared to older ships. Many carriers now publicize their vessel efficiency scores, allowing conscious selection. Our logistics team prioritizes carriers with modern fleets, typically reducing our mask shipment emissions by 15-20% without cost increases.
What operational changes reduce footprint?
Consolidated shipments and route optimization significantly impact emissions. Waiting to accumulate full container loads rather than shipping partial containers can reduce per-mask emissions by 25-40%. Similarly, choosing direct routes instead of transshipment patterns reduces distance and handling emissions. Our consolidation program has reduced average emissions per mask by 0.4-0.7g CO2 across our supply chain.
Conclusion
Calculating carbon footprint for ocean-freighted mask shipments requires specific data on vessel efficiency, container utilization, shipping distances, and mask characteristics. The most accurate approaches combine carrier-specific emission factors with detailed shipment information through standardized methodologies like the GLEC Framework. While calculation requires initial investment in data collection and systems, the results inform both sustainability reporting and operational improvements that can significantly reduce environmental impact.
Beyond measurement, the real value comes from using carbon data to optimize logistics decisions—selecting more efficient vessels, improving container utilization, consolidating shipments, and choosing optimal routes. These operational improvements typically reduce emissions by 20-35% while often lowering costs, creating both environmental and business benefits.
Ready to accurately calculate and reduce the carbon footprint of your mask shipments? Contact our Business Director, Elaine, at elaine@fumaoclothing.com to discuss our carbon calculation services and reduction strategies. We'll help you implement measurement systems that support your sustainability goals while optimizing your supply chain efficiency.