Comparing costs between Chinese and Southeast Asian fabric mask suppliers requires looking beyond simple per-unit quotes to understand the complete financial picture. Many businesses make the mistake of comparing only manufacturing costs while ignoring significant differences in logistics, tariffs, compliance, and operational efficiency that dramatically impact total cost of ownership. A comprehensive comparison must account for both visible and hidden costs across the entire supply chain.
Comparing true costs between Chinese and SEA fabric mask suppliers requires analyzing manufacturing costs, logistics expenses, tariff implications, compliance costs, quality consistency, and operational efficiency across multiple scenarios. The most accurate comparisons model total landed costs for different order volumes and product complexities rather than simply comparing factory gate prices.
The true cost advantage often shifts based on order volume, product complexity, and target markets—with China typically offering better economies of scale for sophisticated products, while SEA countries may provide cost advantages for simpler designs targeting specific regional markets. Let's examine the specific cost components that must be included in a meaningful comparison.
What Direct Manufacturing Cost Differences Exist?
The factory-gate price represents just one component of true cost, but understanding its drivers helps identify where each region excels.

How do labor costs compare between regions?
Chinese manufacturing wages have increased significantly, with skilled sewing operators now earning $600-$900 monthly in major industrial regions, while SEA countries like Vietnam ($350-$550), Indonesia ($250-$450), and Cambodia ($200-$350) offer lower labor rates. However, Chinese workers typically demonstrate 3-4 times higher productivity due to better training and more advanced manufacturing systems. This productivity advantage often offsets the higher wage rates for complex operations. Our analysis shows that for technically sophisticated masks requiring multiple components and precise construction, Chinese manufacturing can be 10-15% more cost-effective despite higher hourly rates.
What about material costs and availability?
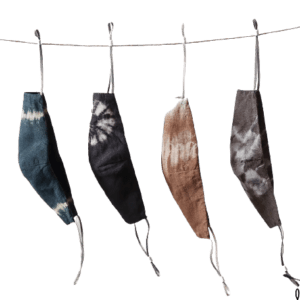
China's integrated textile ecosystem provides significant material cost advantages, with fabric prices typically 15-25% lower than in SEA countries due to massive scale and local processing. The Keqiao textile market alone offers 30,000+ fabric varieties with minimal logistics costs for Chinese manufacturers. SEA suppliers often import fabrics from China or Korea, adding transportation costs and import duties. For custom or technical fabrics, this difference becomes even more pronounced—our custom antimicrobial fabric costs 18% less when manufactured in China versus imported to Vietnam.
What Logistics and Tariff Considerations Impact Total Costs?
Shipping costs, lead times, and tariff structures vary significantly between regions and dramatically affect total landed costs.
How do shipping costs and times compare?
China's established logistics infrastructure provides more competitive shipping rates to most global markets, with 20-30% lower container costs to North America and Europe compared to shipments from most SEA countries. Additionally, more frequent sailings and direct routes reduce transit times by 5-12 days. However, for companies targeting ASEAN or Australian markets, SEA sourcing offers clear logistics advantages. Our landed cost calculations show that for US-bound shipments, China's logistics advantage typically offsets a 5-8% manufacturing cost premium.
What about tariff implications for different markets?
Trade agreements and tariff structures significantly impact cost comparisons. Chinese exports face Section 301 tariffs of 7.5-25% for US-bound masks, while SEA countries like Vietnam (0-3%), Indonesia (0-5%), and Cambodia (0%) benefit from preferential trade status. However, rules of origin requirements mean that masks using Chinese fabrics may not qualify for these preferential rates. The most advantageous approach often involves sourcing simpler masks entirely from SEA for tariff-sensitive markets, while using Chinese manufacturing for complex products where the production cost advantage outweighs tariff disadvantages.
What Operational and Compliance Costs Differ?
Beyond direct manufacturing, operational expenses for quality management, communication, and compliance vary significantly between regions.
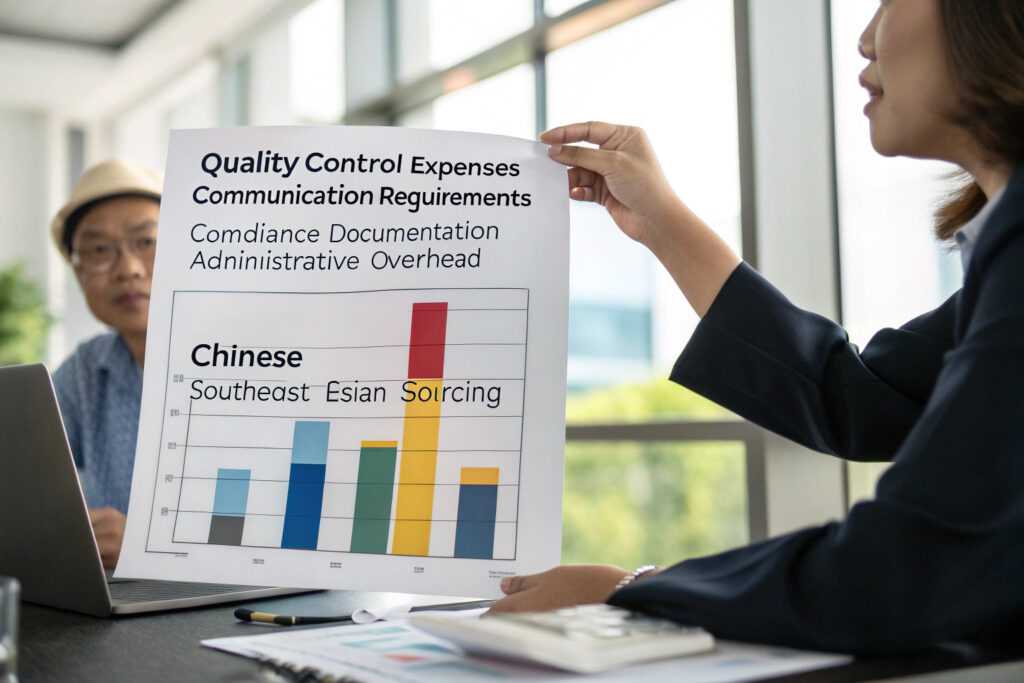
How do quality control costs compare?
Chinese manufacturers typically have more robust quality systems implemented, reducing the need for extensive third-party inspection. In contrast, SEA suppliers often require more rigorous (and costly) quality monitoring, with inspection costs typically 2-3 times higher to achieve equivalent quality levels. Our data shows that while basic QC costs average 0.5-1% of order value in China, they often reach 1.5-3% in SEA countries where manufacturing experience with technical textiles is less developed.
What about communication and project management overhead?
The language barrier and cultural differences in SEA countries often require more extensive (and expensive) project management. While Chinese manufacturers in key industrial regions have extensive experience serving Western markets with English-speaking staff, communication in SEA countries typically requires local agents or more complex management structures. This additional overhead typically adds 2-4% to operational costs for SEA sourcing compared to established Chinese suppliers.
How Does Production Scale Affect Cost Comparisons?
The optimal sourcing location often changes based on order volume, with different breakpoints for different product types.

At what volumes do Chinese suppliers become more competitive?
Chinese manufacturers achieve significant economies of scale at lower production thresholds due to more specialized equipment and deeper supply chains. For orders above 50,000 units, Chinese per-unit costs typically become 15-25% lower than SEA alternatives for technically complex masks. For simpler designs, this crossover point occurs around 100,000 units. Below these volumes, SEA suppliers can be more competitive, particularly for basic designs where their labor cost advantage isn't offset by Chinese efficiency advantages.
How do minimum order quantities differ?
Chinese suppliers typically require higher MOQs (5,000-10,000 units per design) compared to SEA alternatives (1,000-5,000 units), reflecting their focus on larger-scale production. This makes SEA sourcing more accessible for market testing and smaller collections, while Chinese manufacturing becomes more economical for established products with predictable demand. Our clients often use a hybrid approach—testing new designs in SEA at lower volumes, then transitioning to Chinese production once volumes justify the shift.
What Risk Factors Should Be Included in Cost Calculations?
Various risk factors carry financial implications that must be quantified for accurate cost comparisons.
How should political and regulatory risks be quantified?
Geopolitical tensions and trade policy uncertainty create potential cost exposures that differ by region. Chinese sourcing carries risks related to US-China trade tensions, while SEA sourcing involves different political stability considerations. A reasonable risk premium for Chinese sourcing might be 3-5% to account for potential tariff increases, while SEA sourcing might warrant a 2-4% premium for less predictable regulatory environments. These percentages should be adjusted based on your specific risk tolerance and market exposure.
What about supply chain reliability differences?
Chinese supply chains demonstrated better resilience during COVID disruptions due to more integrated ecosystems and government support for manufacturing. The cost of stockouts and production delays needs to be factored into comparisons—our analysis suggests a 2-3% reliability premium for Chinese manufacturing based on more consistent performance during recent global disruptions. This is particularly valuable for products with seasonal demand or tight marketing timelines.
Conclusion
Comparing true costs between Chinese and SEA fabric mask suppliers requires modeling total landed costs across multiple scenarios rather than simply comparing manufacturing quotes. Chinese suppliers typically offer advantages for complex, high-volume production benefiting from integrated supply chains and manufacturing efficiency, while SEA suppliers can be more competitive for simpler designs, lower volumes, and tariff-sensitive markets. The most effective sourcing strategies often involve a portfolio approach—using each region for its comparative advantages rather than seeking a single sourcing solution.
The optimal choice depends heavily on your specific product complexity, order volumes, target markets, and risk tolerance. Companies should regularly reassess this balance as conditions in both regions continue to evolve, particularly as SEA manufacturing capabilities advance and Chinese automation increases.
Ready to conduct a detailed cost comparison for your specific fabric mask requirements? Contact our Business Director, Elaine, at elaine@fumaoclothing.com to discuss our multi-region manufacturing capabilities and receive a customized total cost analysis comparing Chinese and SEA production options for your products. We'll help you identify the optimal sourcing strategy based on your business objectives and market requirements.