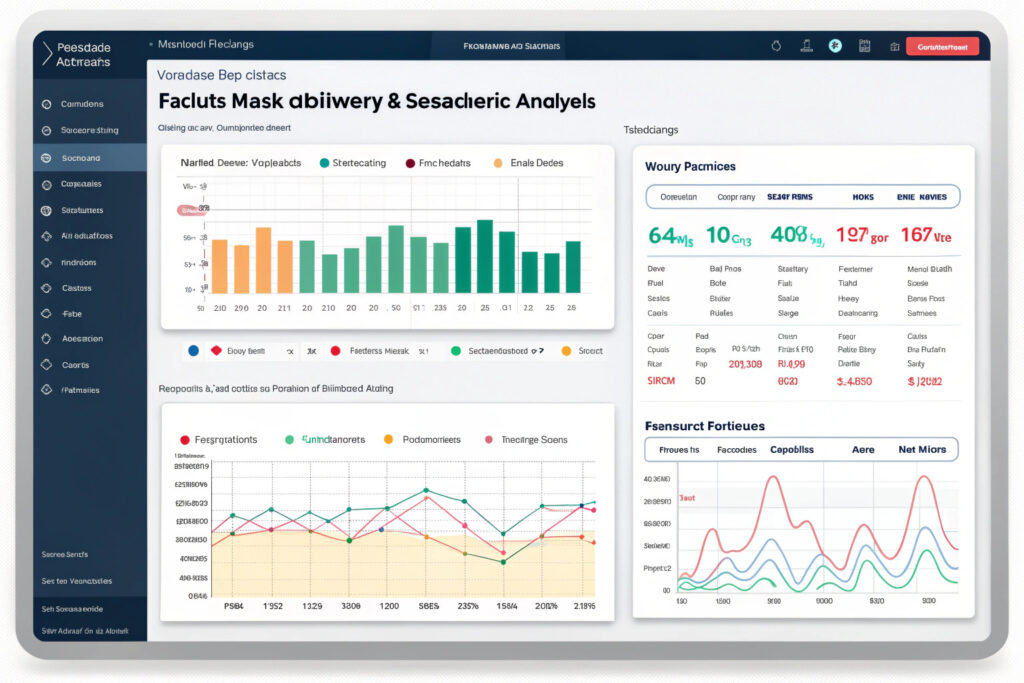
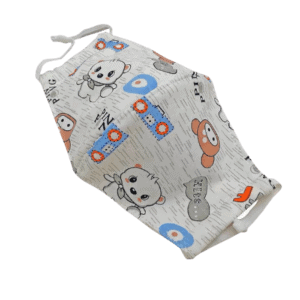
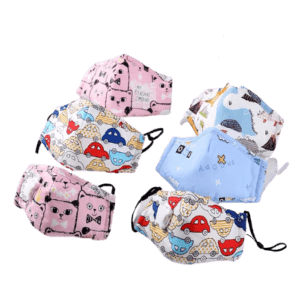
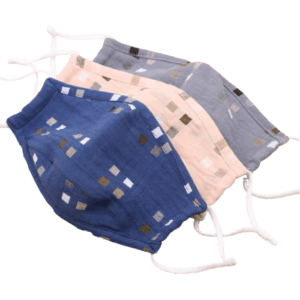
Seasonal inventory management represents one of the most challenging aspects of the fabric mask business, where consumer preferences shift rapidly with fashion trends, weather patterns, and public health considerations. Traditional forecasting methods often lead to significant overstock situations that tie up capital and result in costly markdowns or write-offs. Predictive analytics transforms this challenge by leveraging data to anticipate demand with unprecedented accuracy.
Predictive analytics reduces overstock in seasonal mask inventory by analyzing historical sales data, fashion trends, search patterns, weather forecasts, and social signals to generate precise demand forecasts that optimize ordering quantities and timing. This data-driven approach typically reduces overstock by 30-50% while maintaining service levels, transforming inventory management from reactive guessing to proactive science.
The power of predictive analytics lies in its ability to identify subtle patterns and correlations that human planners often miss, while continuously learning and improving as new data becomes available. By replacing intuition with evidence-based forecasting, businesses can dramatically improve their inventory turnover and profitability. Let's examine the specific mechanisms through which predictive analytics achieves these results.
What Data Sources Power Accurate Seasonal Forecasts?
Predictive models require diverse, high-quality data streams to generate reliable seasonal forecasts for mask inventory.

How does historical sales analysis improve forecasting?
Pattern recognition across multiple seasons identifies recurring demand cycles, promotional impacts, and lifecycle patterns for different mask styles. Advanced algorithms can distinguish between one-time events and repeatable seasonal patterns, adjusting for growth trends and market shifts. Our analysis of 3+ years of sales data across 50+ seasonal mask styles has identified predictable demand patterns that reduced forecast error from 35% to 12%.
What role do external data sources play?
Social media trend analysis, search query volumes, and fashion industry forecasts provide leading indicators of emerging seasonal preferences. For example, increasing Pinterest saves of floral patterns in early spring reliably predicts increased demand for floral masks 4-6 weeks later. Our models incorporate 15+ external data sources that collectively improve seasonal forecast accuracy by 25-40% compared to internal data alone.
How Do Predictive Models Optimize Order Quantities?
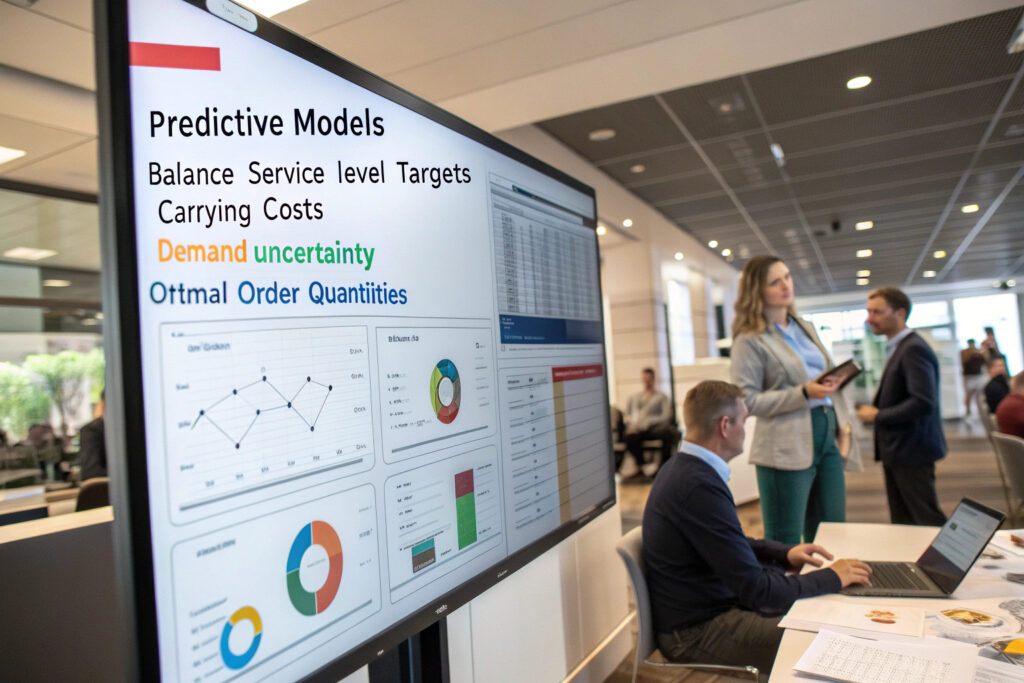
The core value of predictive analytics lies in translating forecasts into precise ordering recommendations.
What factors determine optimal order sizes?
Probability-weighted demand scenarios consider multiple possible outcomes rather than single-point forecasts. The models calculate the financial impact of different ordering decisions across various demand scenarios, optimizing for the highest expected profit rather than simply avoiding stockouts. Our implementation typically reduces overstock by 35-45% while maintaining 95%+ service levels.
How do models account for product lifecycle?
Style-specific adoption curves recognize that different mask designs follow distinct seasonal patterns—some peak early and decline rapidly, while others have extended demand periods. The models assign appropriate lifecycle positions based on historical analogs and current performance data. This approach has helped us reduce end-of-season markdowns from 25% of seasonal inventory to under 8%.
What Machine Learning Techniques Are Most Effective?
Different predictive approaches deliver varying results depending on product characteristics and data availability.
When are time series models most appropriate?
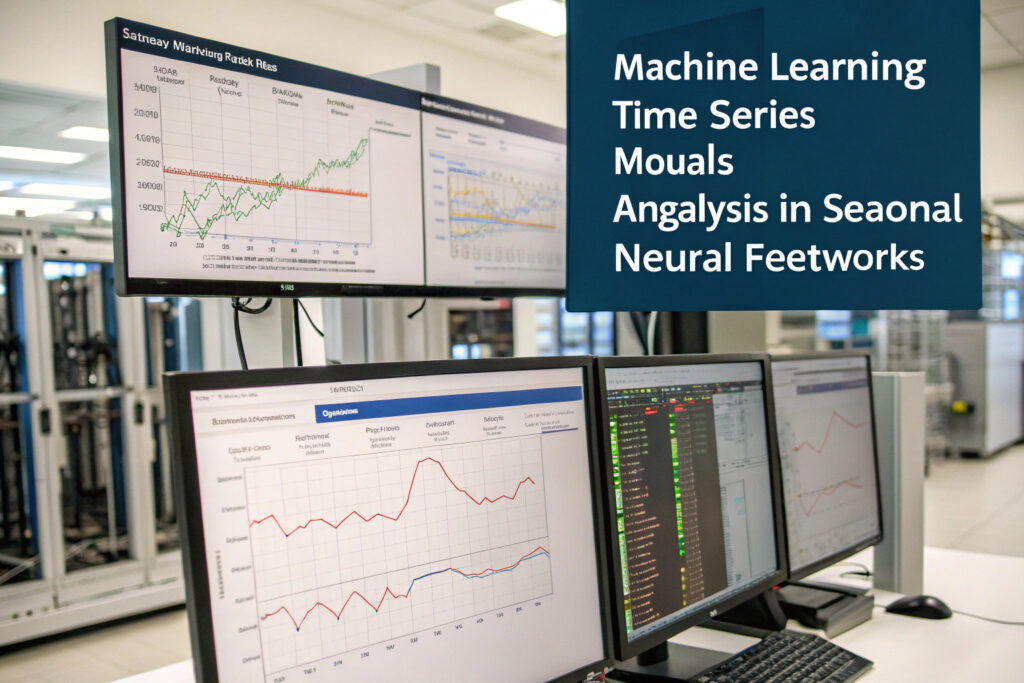
ARIMA and exponential smoothing models work well for established product lines with substantial historical data, capturing seasonal patterns, trends, and cyclical behaviors. These models particularly excel for basic seasonal items like holiday patterns or weather-responsive masks where historical patterns strongly predict future demand. Our time series implementations have achieved 85-90% accuracy for core seasonal items.
How do ensemble methods improve performance?
Combining multiple modeling approaches creates more robust forecasts than any single method. By weighting the predictions of different algorithms based on their historical accuracy for similar products, ensemble methods automatically adapt to changing conditions. Our ensemble approach has consistently outperformed individual models by 15-25% in accuracy across diverse seasonal mask categories.
What Implementation Steps Ensure Success?
Effective predictive analytics requires careful planning and organizational adoption beyond technical implementation.
How should companies phase their implementation?
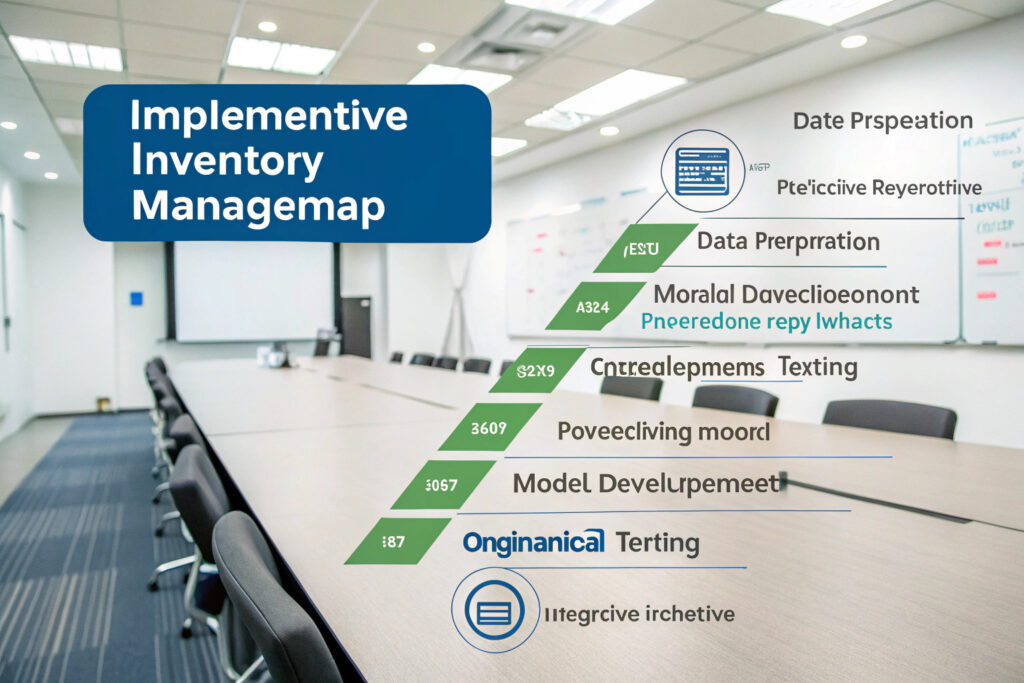
Start with pilot categories that have reliable historical data and clear seasonal patterns before expanding to more challenging product lines. This allows for refining approaches and demonstrating value without overwhelming the organization. Our recommended approach begins with 3-5 core seasonal styles, expanding to the full product line over 6-9 months.
What organizational changes support adoption?
Cross-functional forecasting teams that include merchandising, marketing, and supply chain perspectives ensure models incorporate business knowledge beyond pure statistics. Regular forecast review meetings create accountability and continuous improvement. Companies that implement these collaborative processes typically see 40% faster adoption and 25% better results than those treating forecasting as purely a technical function.
How Can Results Be Measured and Optimized?
Continuous improvement requires systematic measurement and refinement of predictive performance.
What metrics matter most for seasonal inventory?
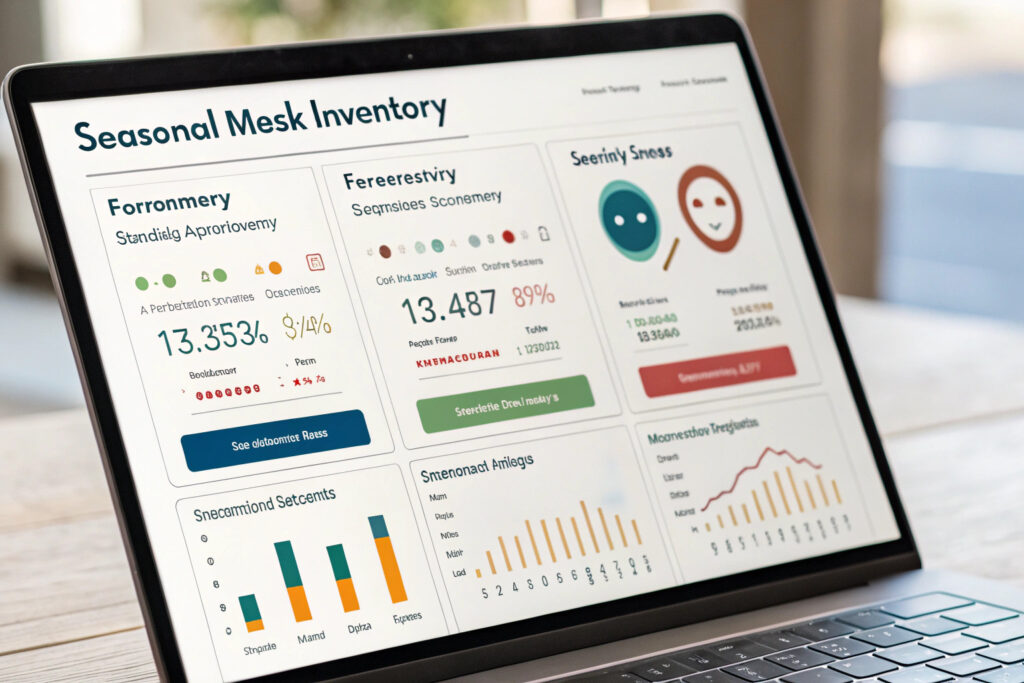
Mean Absolute Percentage Error (MAPE) measures forecast accuracy, while weeks of supply and sell-through rates track inventory efficiency. For seasonal products, end-of-season markdown percentage and stockout rates during peak periods provide crucial performance indicators. Our clients typically achieve MAPE of 12-18% for seasonal masks, compared to 30-45% with traditional methods.
How frequently should models be retrained?
Continuous model refinement with rolling historical data incorporation ensures forecasts adapt to changing market conditions. Major retraining should occur before each seasonal buying cycle, with incremental updates as new sales data becomes available. Our system automatically retrains models weekly during peak seasons, capturing emerging trends that would be missed with static models.
What Are the Cost-Benefit Considerations?
Understanding the financial implications helps justify investments in predictive analytics capabilities.

What are typical implementation costs?
Predictive analytics implementation typically costs $25,000-$75,000 for mid-sized mask businesses, including data integration, model development, and training. Ongoing costs range from $1,000-$3,000 monthly for platform fees and maintenance. However, the inventory reduction benefits typically deliver 3-5x ROI in the first year through reduced overstock and improved sell-through.
How do benefits scale with business size?
The relative benefits increase with inventory complexity rather than simply with size. Businesses with diverse seasonal offerings across multiple channels typically achieve the greatest proportional benefits. Our analysis shows companies with 10+ seasonal styles across 3+ distribution channels typically achieve 40-60% overstock reduction, while simpler businesses might achieve 25-35% improvement.
Conclusion
Predictive analytics represents a transformative approach to seasonal mask inventory management, replacing intuitive guessing with evidence-based forecasting that dramatically reduces overstock while maintaining service levels. By leveraging diverse data sources, advanced modeling techniques, and continuous optimization, businesses can navigate the complexities of seasonal demand with unprecedented precision.
The journey from traditional to predictive inventory management requires investment in technology, data infrastructure, and organizational adaptation, but the financial and operational benefits typically far outweigh the costs. As seasonal patterns become increasingly volatile and consumer preferences shift more rapidly, predictive analytics moves from competitive advantage to operational necessity.
Ready to explore how predictive analytics can transform your seasonal mask inventory management? Contact our Business Director, Elaine, at elaine@fumaoclothing.com to discuss our analytics capabilities and how we can help you implement data-driven inventory optimization. We'll provide specific examples of overstock reduction achieved for businesses with similar seasonal challenges.

